
6.2. System Status Category
The system status category pages show the runtime data of the engine and the SCR system in a graphical and a numerical format. The numerical values can show a value like “Percent load: 10%”, error, or some status value like “SCR main state: NoPressureCtl”. If a value is not available, it is shown as grey with text “n/a”.
6.2.1. Engine status
The engine status page provides a view to the ECU runtime data. See figure Engine status page.
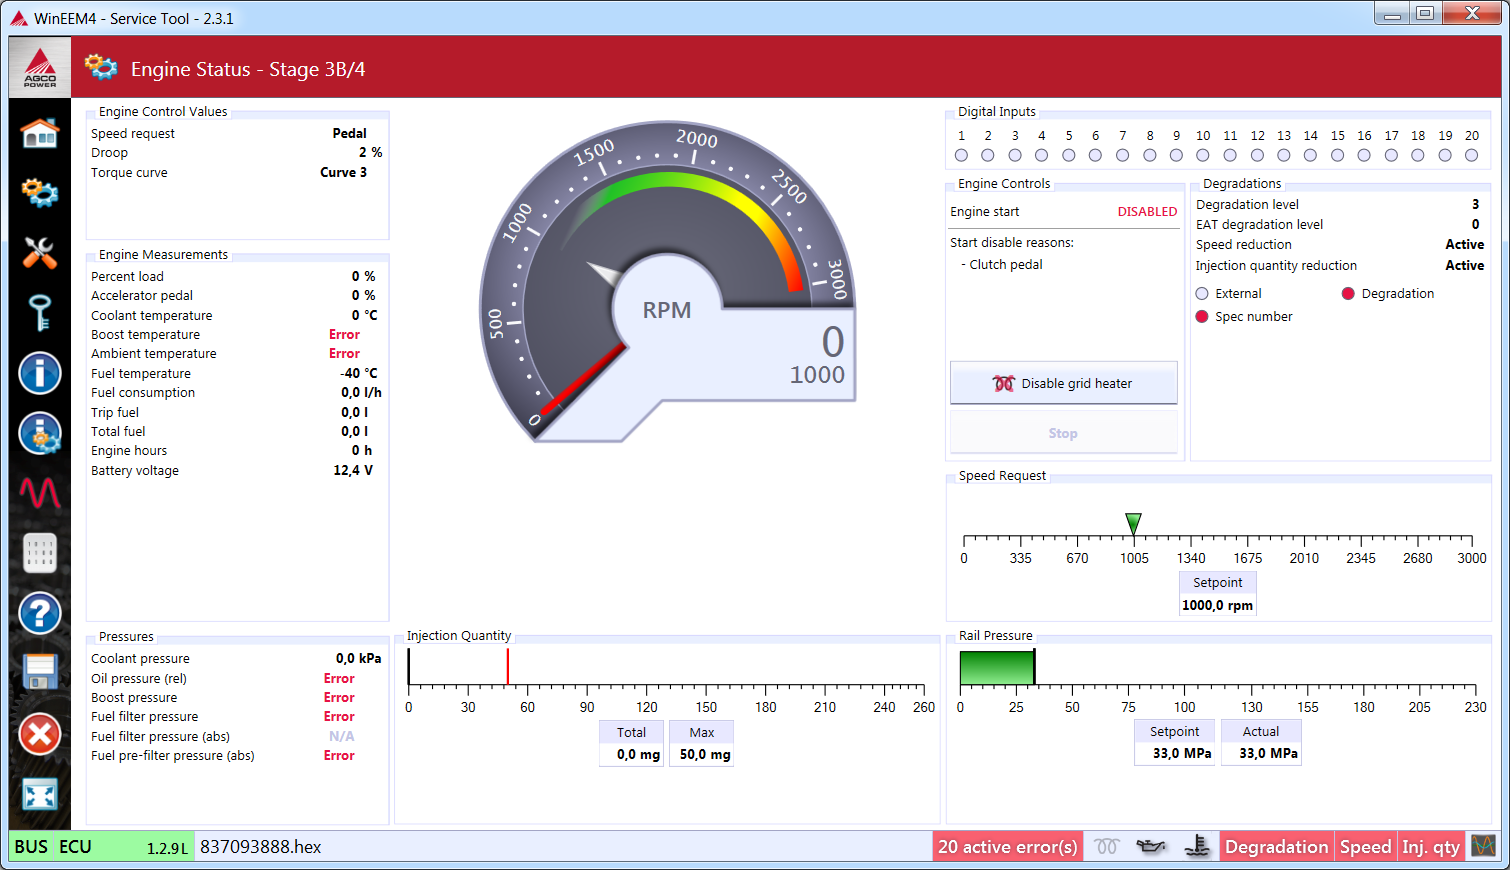
Engine status page
The Engine measurements shows a selection of the most important values for the engine performance.
The Engine pressures shows the coolant, oil, boost, and fuel filter pressures.
The Digital inputs shows the current status of all the ECU digital inputs. If an input is active, it is shown with green color. Otherwise it is shown with grey color.
The Engine control values shows the speed request source (CAN or pedal), the droop percent and the number of the current torque curve.
The Engine speed shows the current engine speed.
The Rail pressure shows the current rail pressure in the rail and its setpoint.
The Speed request shows the rpm of the requested speed.
The Injection quantity shows the fuel injection quantity of each stroke, and the maximum value for the injection quantity at the current operating point.
The Degradations shows the current degradation level, if there are active speed or injection quantity reductions and possible reasons for reductions.
- Red color means that the reduction is active.
- If the color is gray, it means that the current reason is not activating any reductions at this point.
For more information on engine electric system see sections Engine electrical and Sensor details or Engine Components.
6.2.2. Aftertreatment Process
The Aftertreatment process page provides a graphical view to the aftertreatment system runtime data. Each sensor and control value is shown in the process model of the aftertreatment system. See figure Aftertreatment process page.
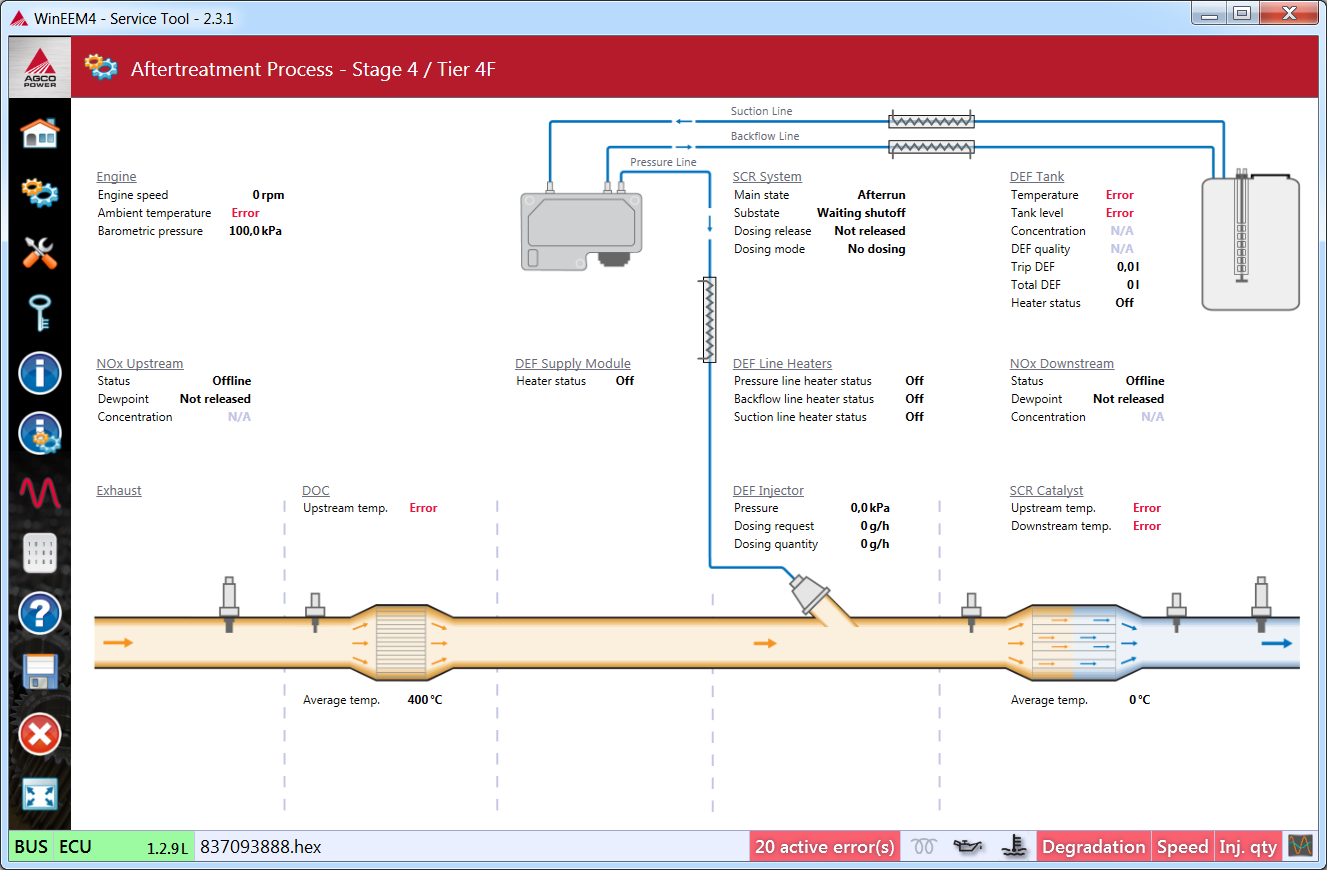
Aftertreatment process page
For more information of the aftertreatment system, see the sections Aftertreatment or Aftertreatment and Sensor details or Engine Components.
6.2.3. Air system
The air system process page provides a graphical view to the Air system runtime data. Each sensor and control value is shown in the process model of the Air system. See figure Air system process page.
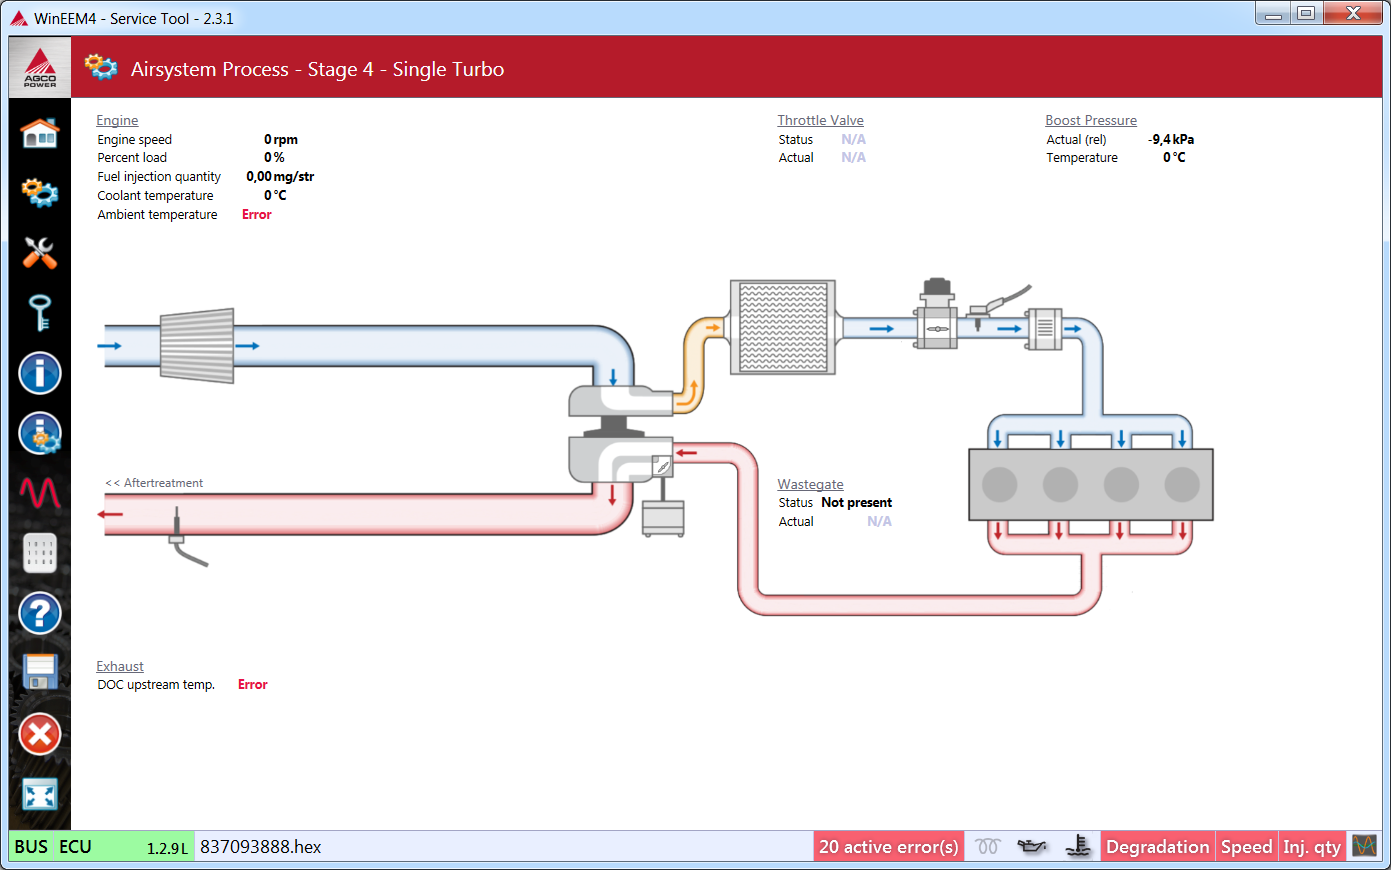
Air system process page
For more information of Air system see sections Aftertreatment or Aftertreatment and Sensor details or Engine Components.